Plot edition
Using the data plot editing tool [Fig. 4.6] it is possible to configure the layout of the selected graph, as well as the layout each data set which happen to be plotted on the graph, it is also possible to configure X and Y axis layout and/or position.
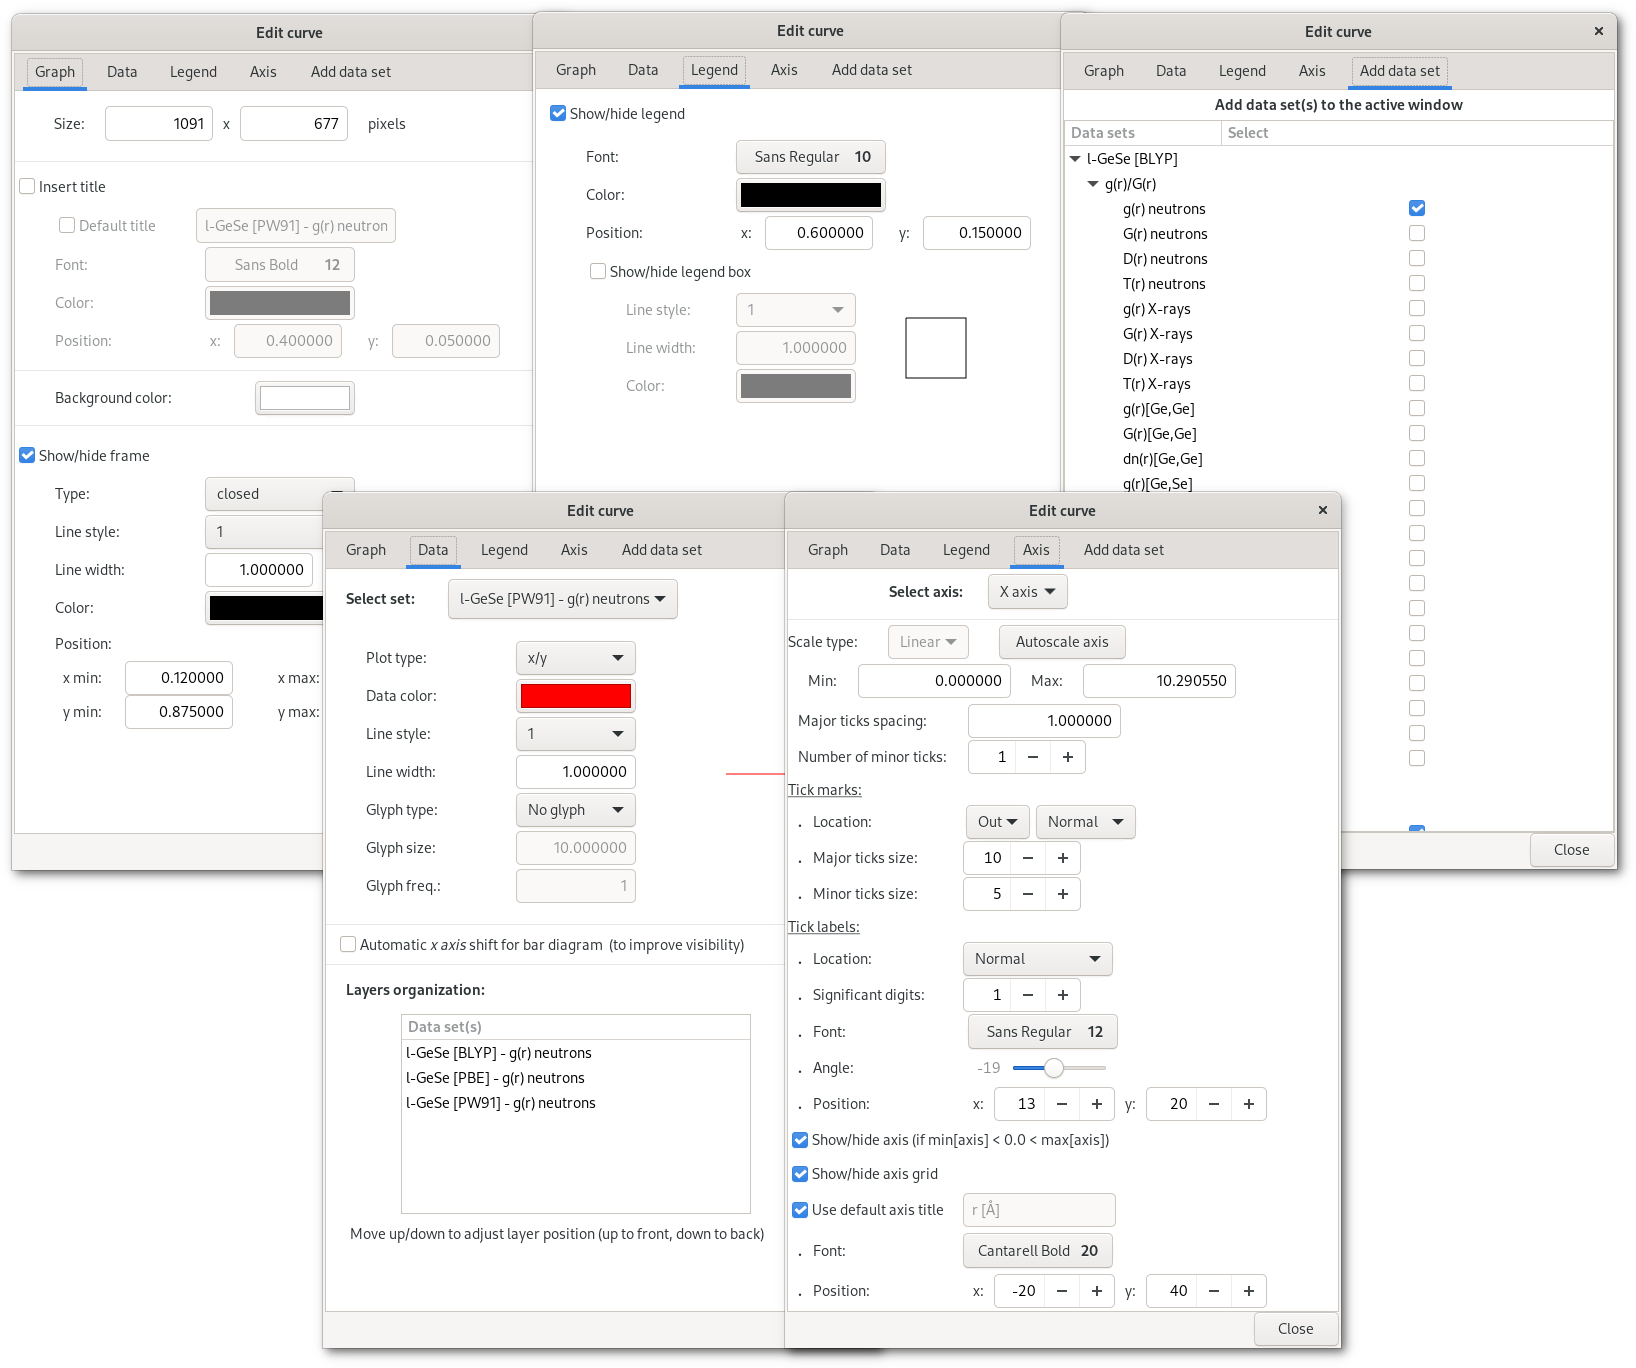
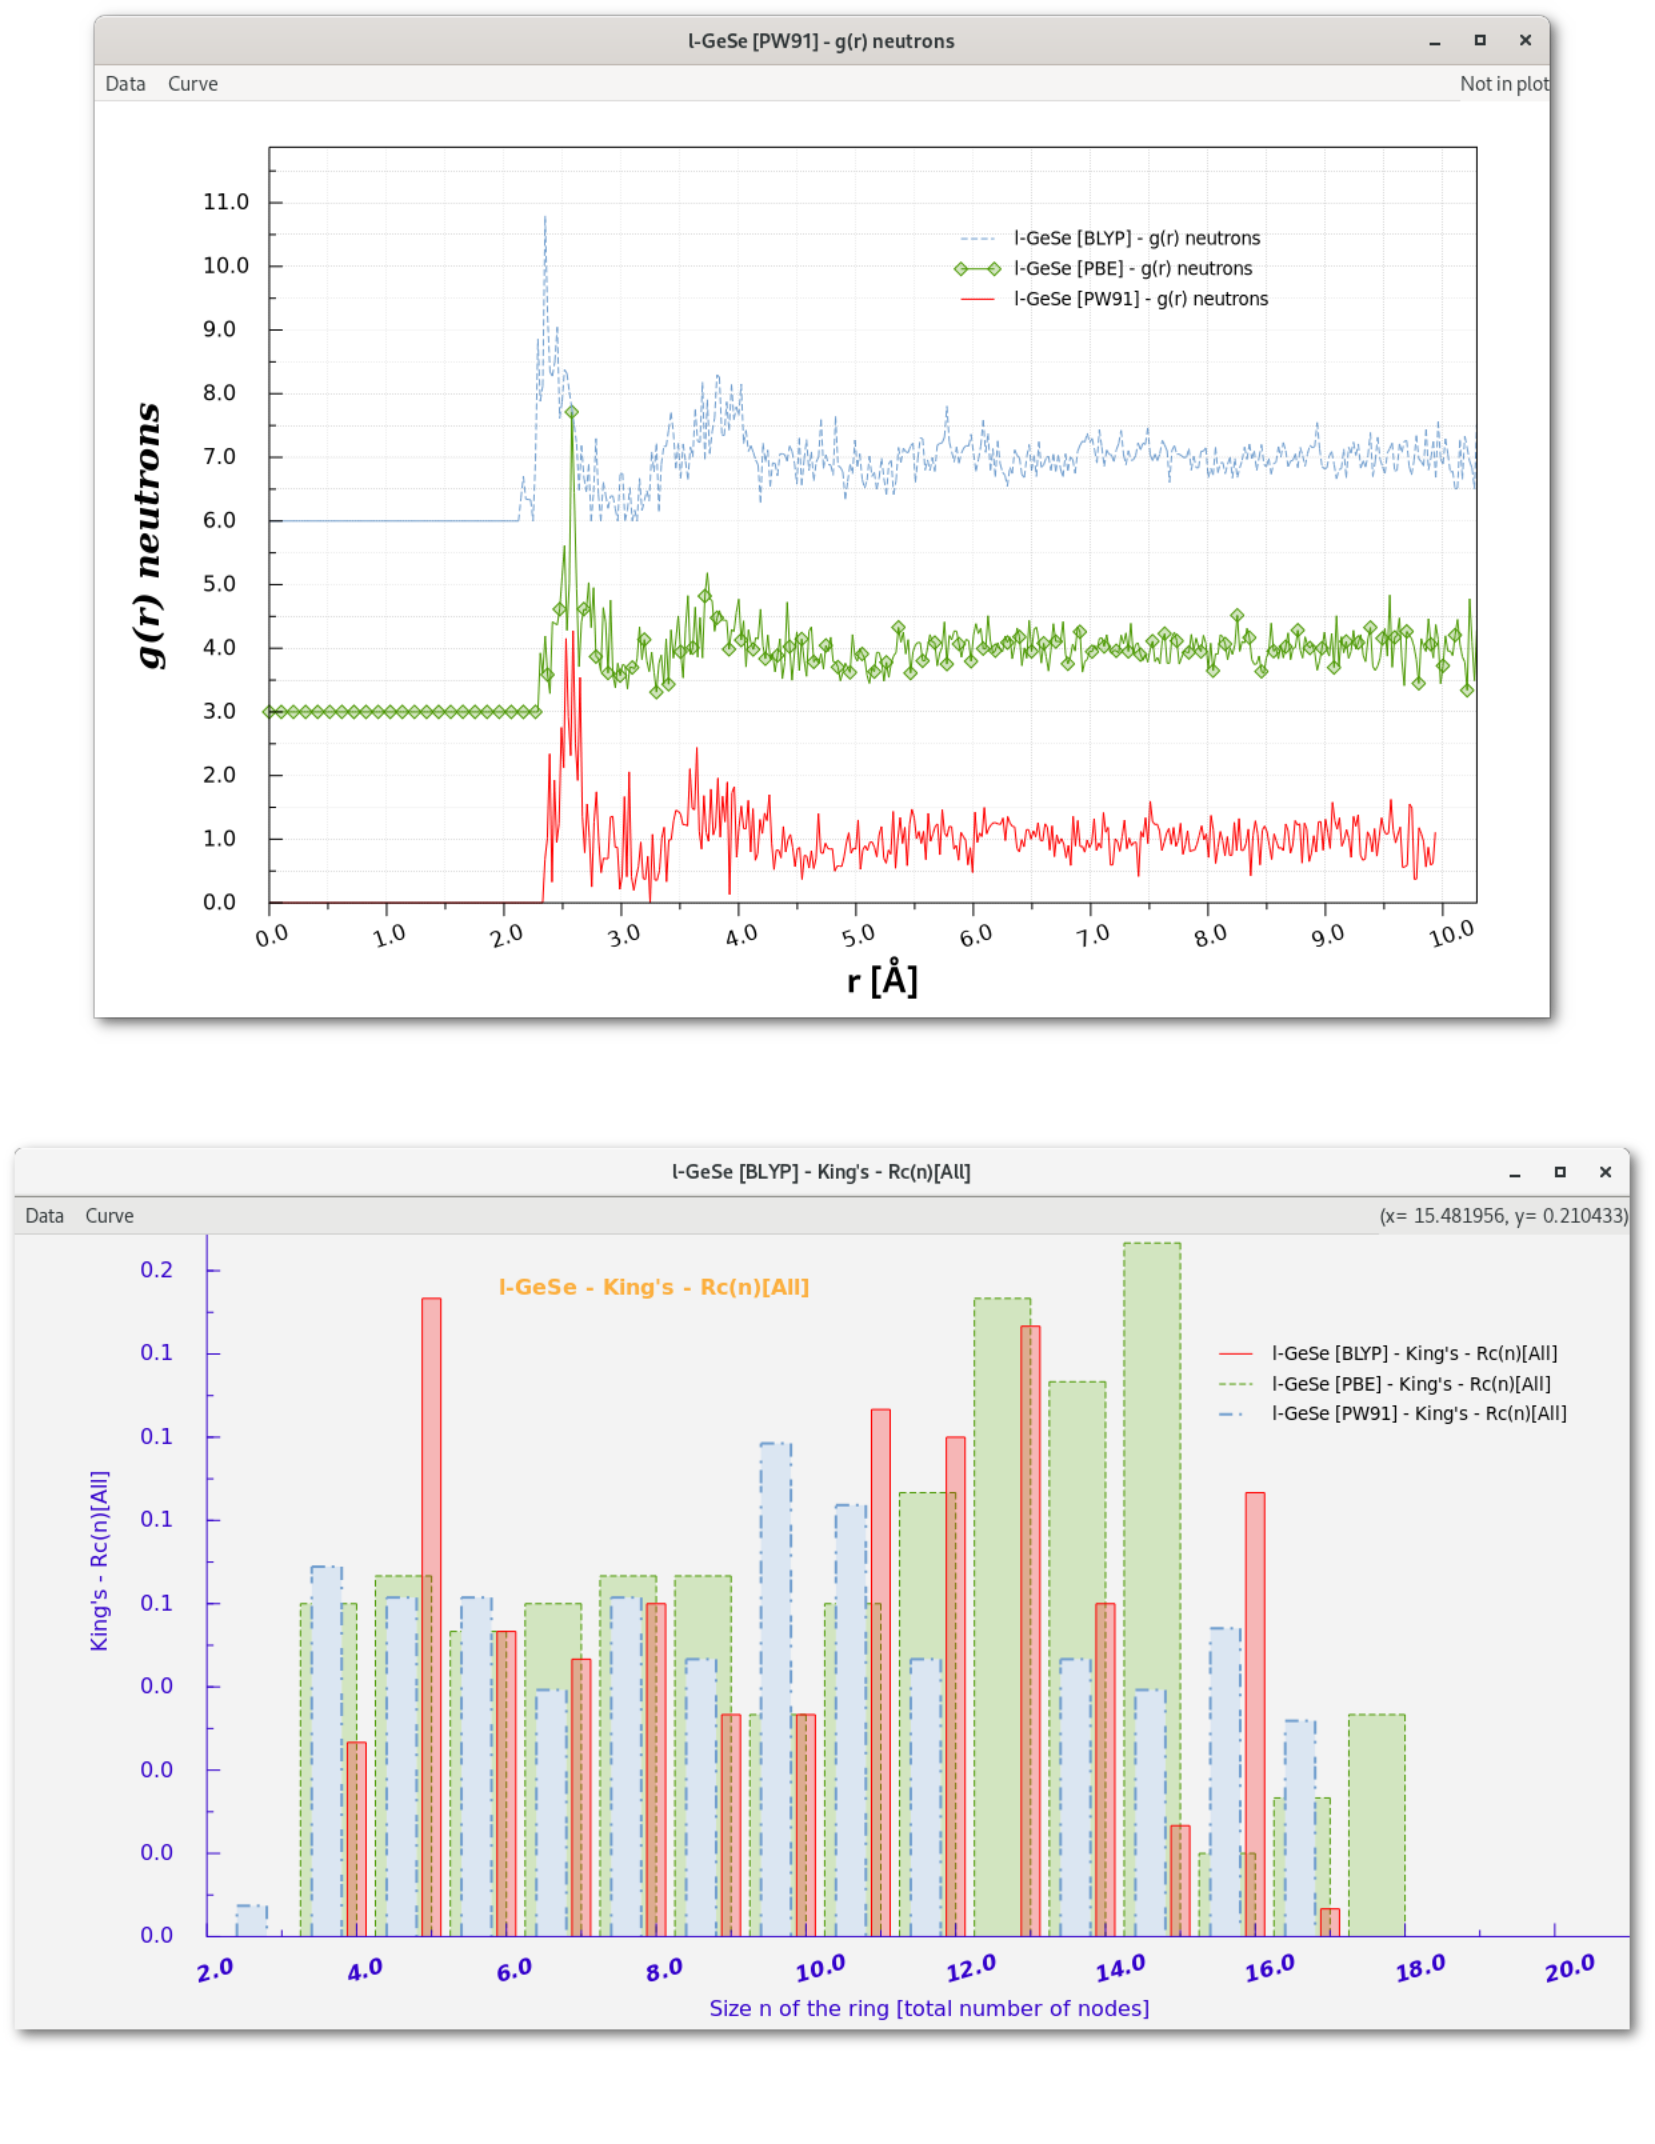
Furthermore depending on the calculation several data sets can be selected and plotted together with the main data set of the active window. Data plot edition in the Atomes program is illustrated with the example in figure 4.7.