Visualisation of the results of the calculations
When a particular structural characteristic is computed results can be directly displayed in the main Atomes windows [Fig. 3.1-a]. In addition the visualization mode of most of the computed characteristics can be controlled the "Toolboxes" dialog:
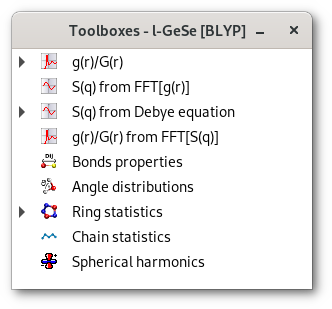
The "Toolboxes" dialog contains a tree that becomes browsable for a particular calculation when that calculation is completed successfully.
If closed the "Toolboxes" dialog can be opened alternatively using:
The last button of the "
Analyze menu" called "Toolboxes" [Fig. 3.1-d].The Ctrl+ t keyboard shortcut over the main window of the Atomes program.
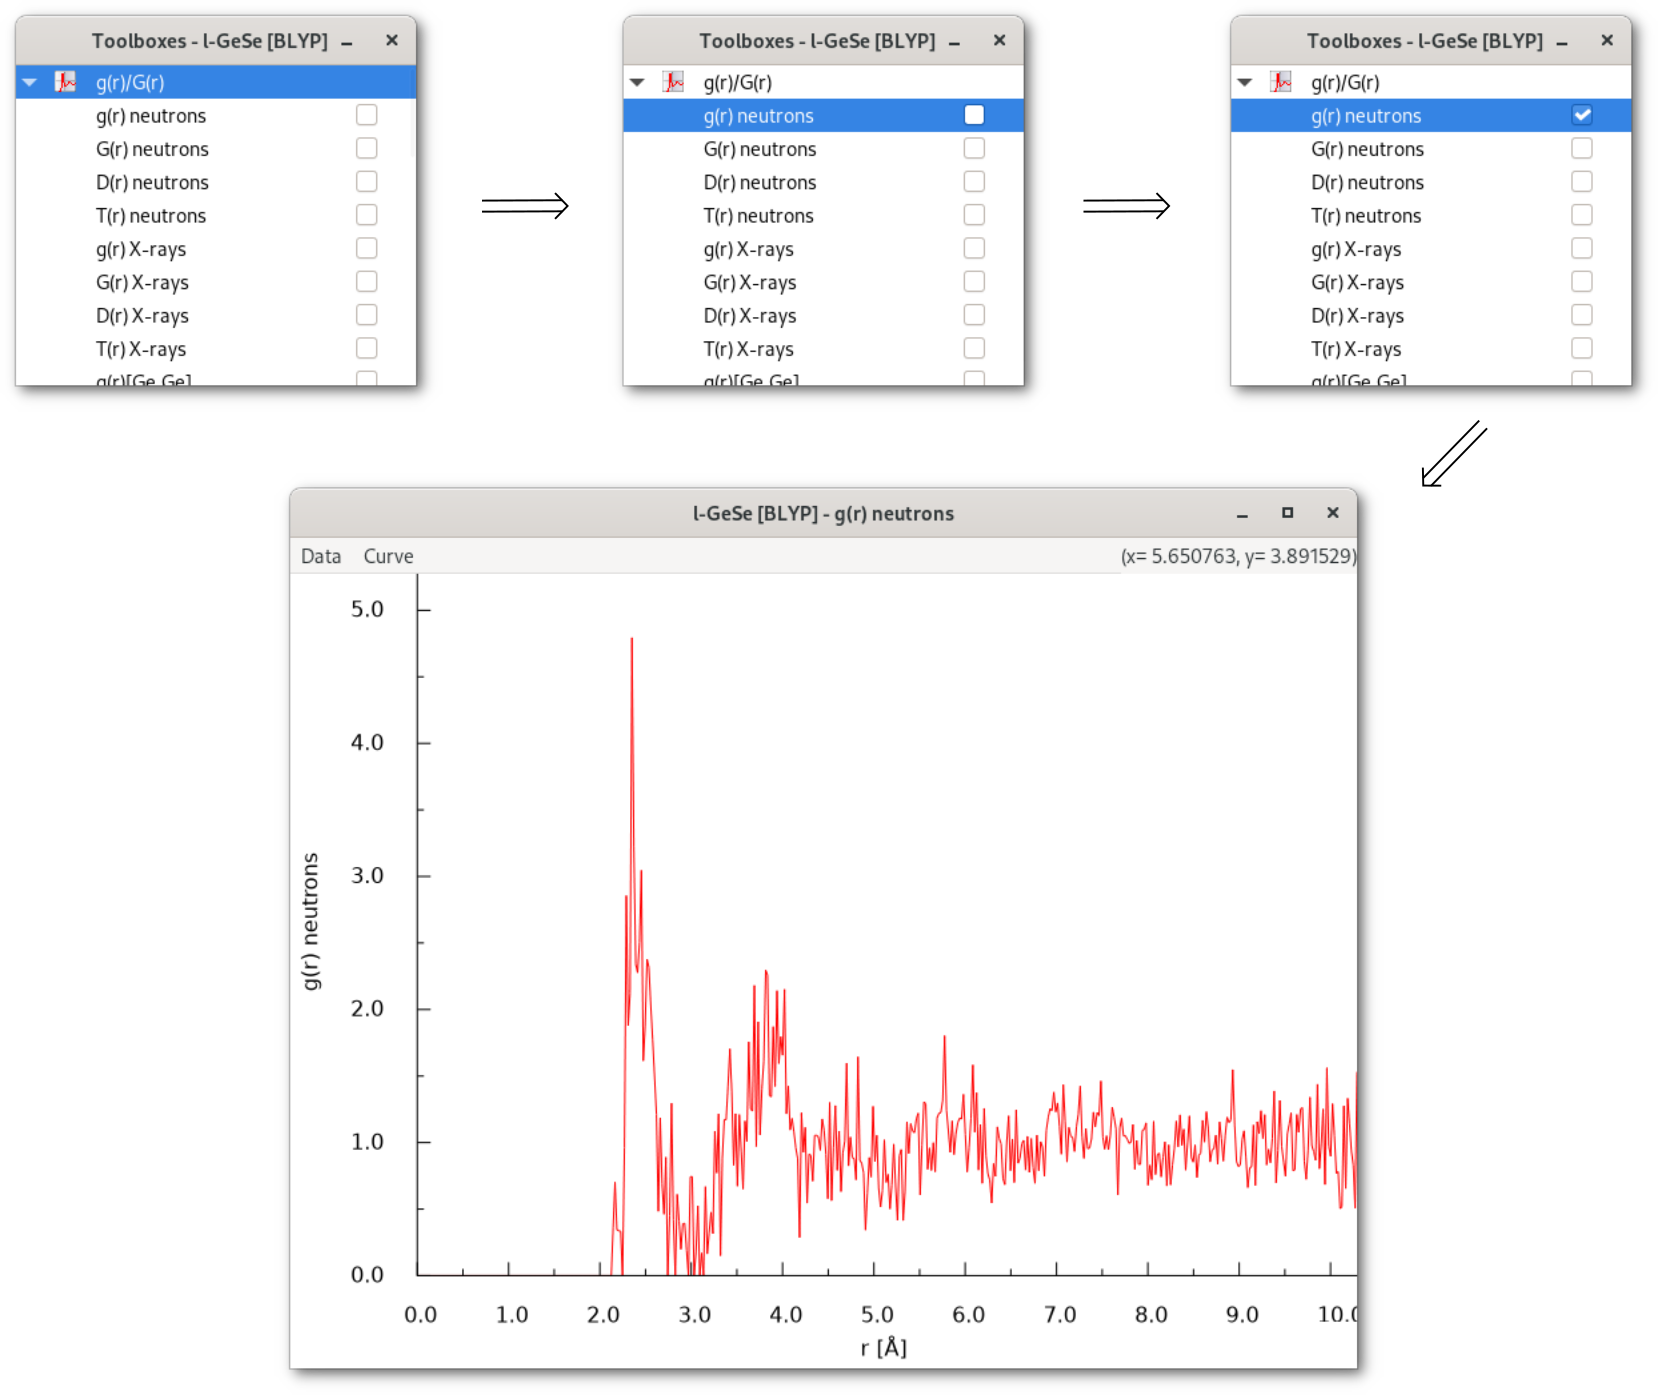
When a button in an interaction menu is activated [Fig. 4.3] the corresponding result is instantaneously displayed as a curve or a histogram [Fig. 4.3] depending on the nature of the computed structural characteristic, in figure 4.2 the g(r) for the project "l-GeSe [PW91]" for the example workspace in figure 4.1.